World Mining Data
The annual publication "World Mining Data" presents production figures of 65 mineral commodities from 168 countries. These data are used for raw material policy assessments and forecasts at national and international level. The world mining data thus form an indispensable basis for raw material forecasts and activities in mineral resources policy at national and European level.
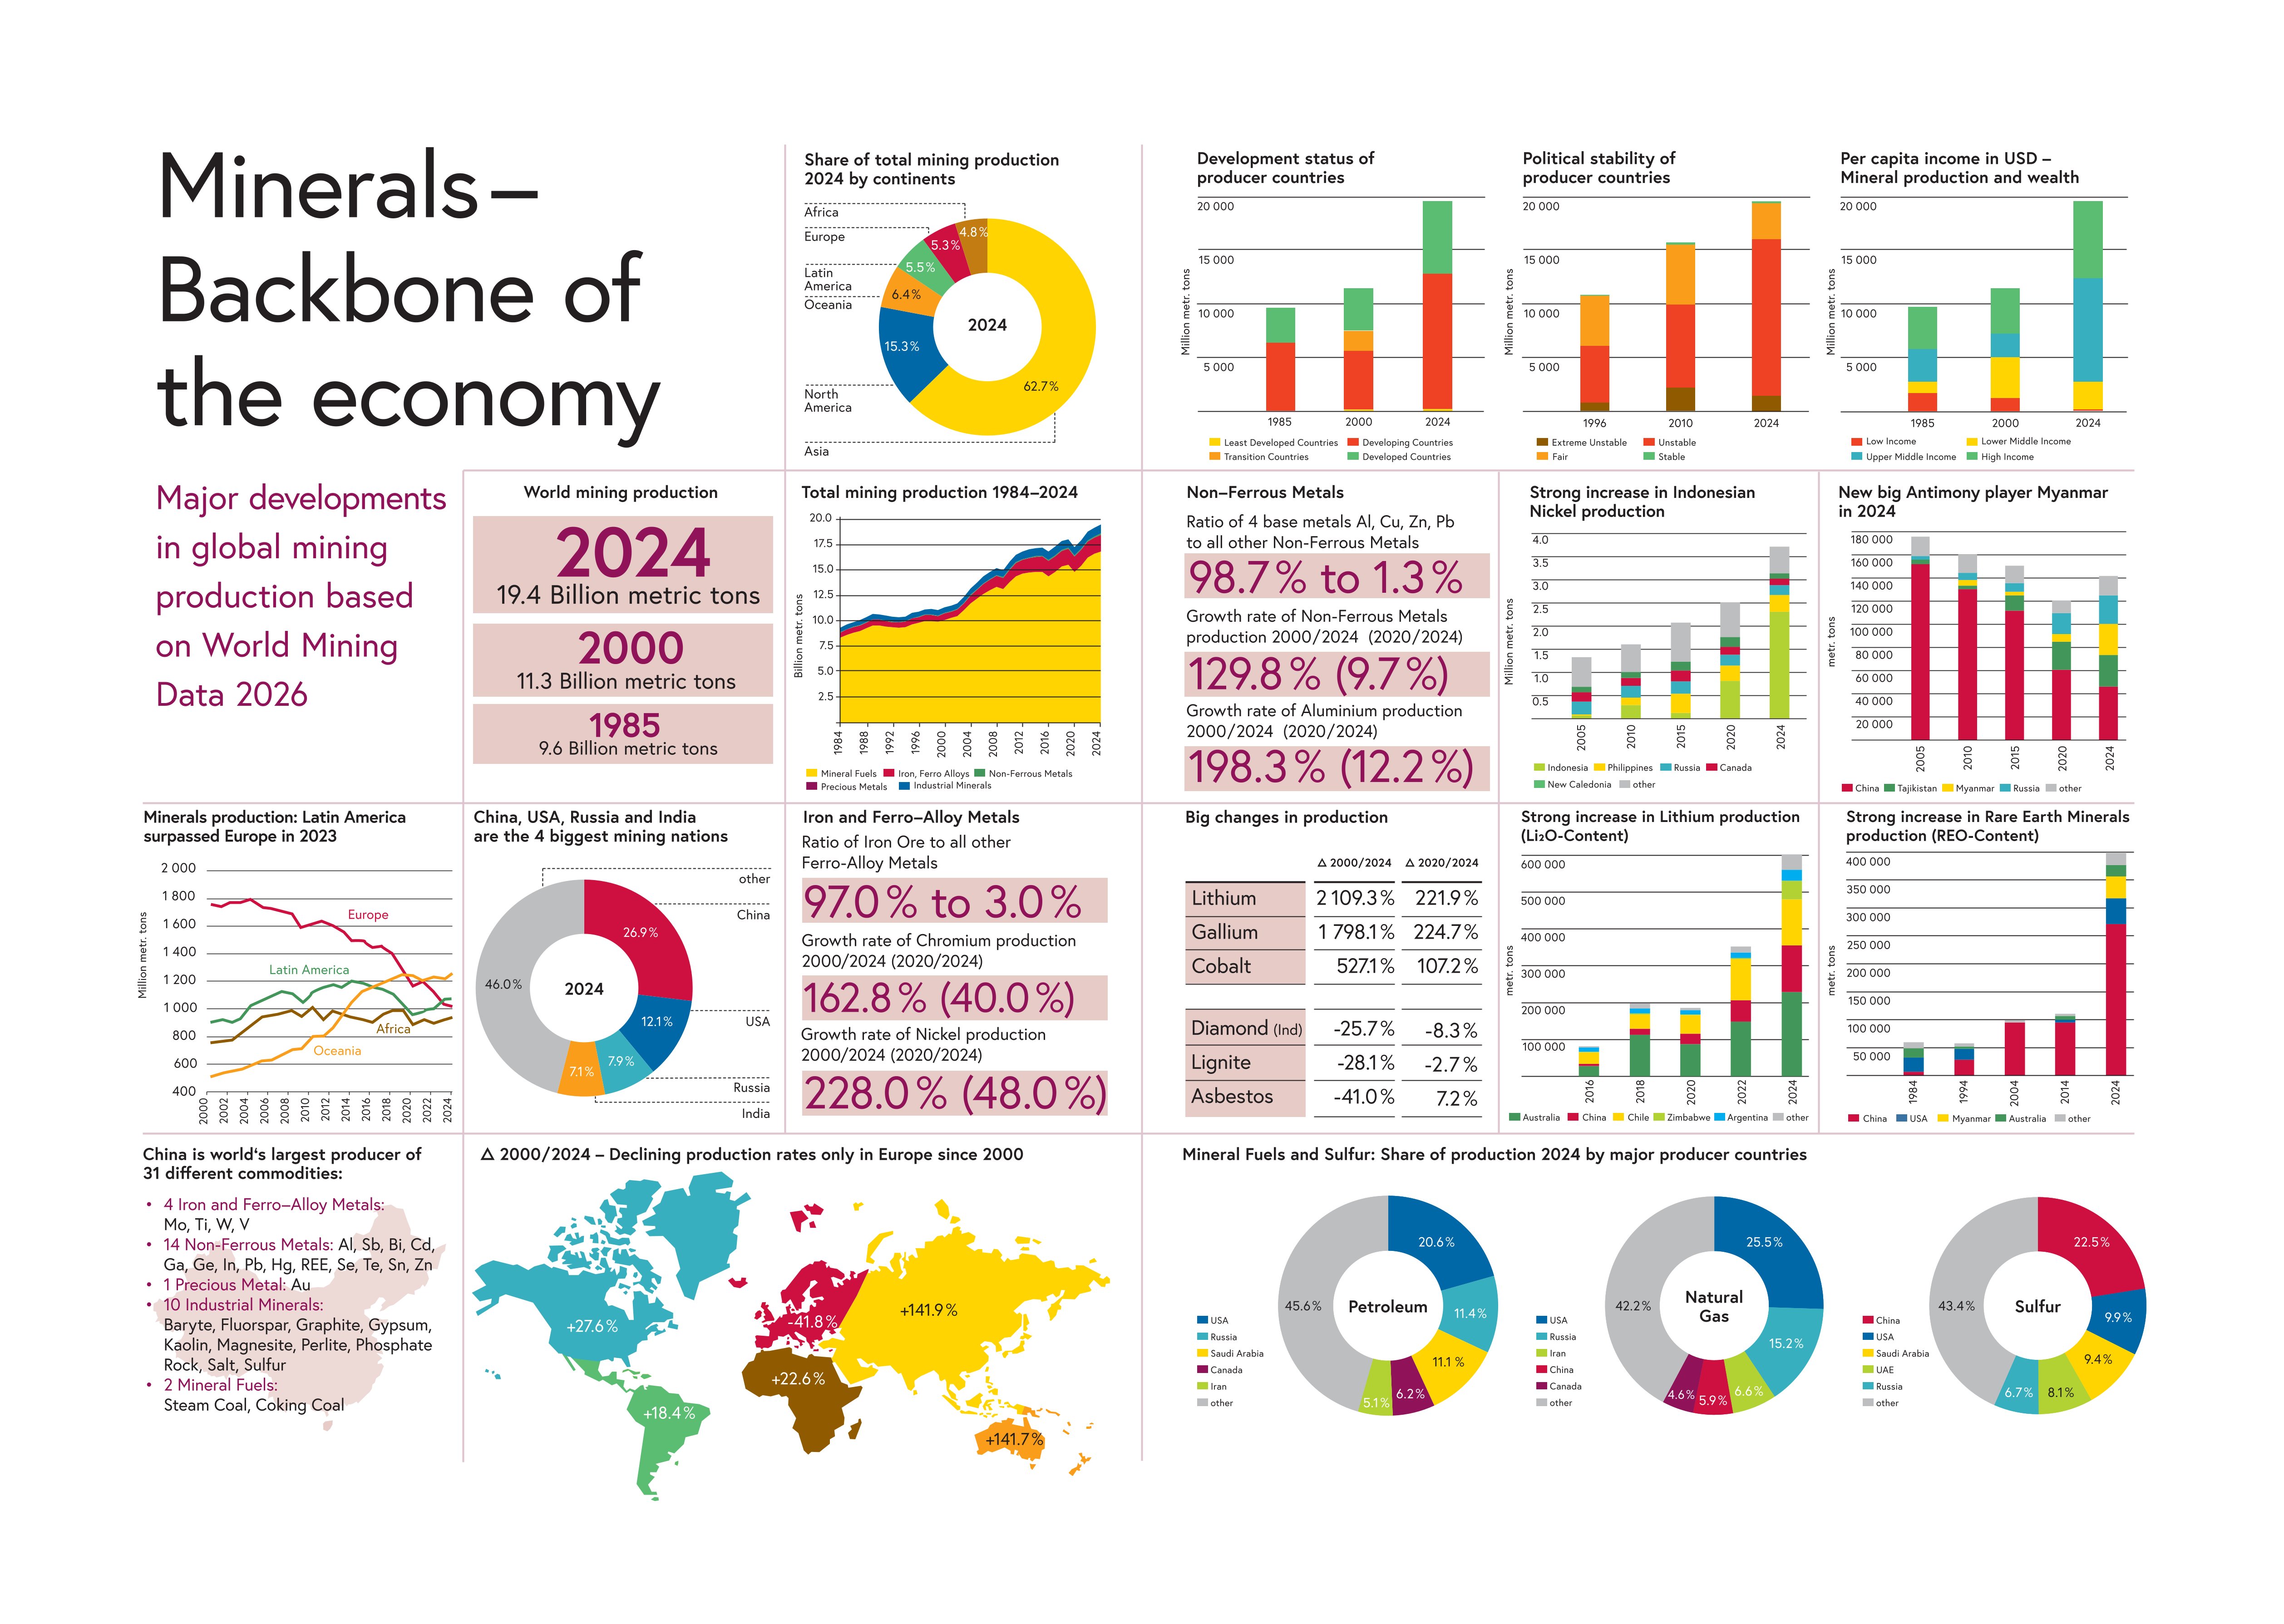
World Mining Data 2026
The current version of the World Mining Data can be downloaded here (PDF, 3 MB).
Below you will find the graphical summary of the most important results of the current World Mining Data. This is also available for download here (PDF, 157 KB).
Printed copies are available free of charge from the Austrian Federal Ministry of Finance, Directorate VI/5 - Mineral Resources Policy.
E-Mail: wmd@bmf.gv.at
Please find attached the WMD data with the production figures of the last 5 years for download.
- Chapter 6.1 - Total World Production (Excel, 96 KB)
- Chapter 6.2 - World Production of Mineral Raw Materials by Raw Materials (Excel, 27 KB)
- Chapter 6.3a - Development status (Excel, 163 KB)
- Chapter 6.3b - Annual per Capita Income (Excel, 161 KB)
- Chapter 6.3c - Political Stability (Excel, 160 KB)
- Chapter 6.3d - Country Groups and Economic Blocks (Excel, 178 KB)
- Chapter 6.4 - Production of Mineral Raw Materials of Countries by Raw Materials (Excel, 245 KB)
- Chapter 6.5 - Share of World production by Country (Excel, 317 KB)
- Chapter 6.6 - Production of Mineral Raw Materials of countries by countries (Excel, 658 KB)
Data Capture
Data collection relating to mineral raw materials has been carried out through evaluation of questionnaires sent to the National Committees of member countries of the World Mining Congress as well as to other bodies such as Embassies, Foreign Trade Representatives etc. Other official mining statistics, where publically available, have also been used; for example, data gathered by the BGS (World Mineral Production) and the USGS have proven very useful for cross-checks.
For the present publication the complete data set has been reviewed carefully. Despite a diligent search of all sources, there are some producing areas where data is unavailable. In such instances, careful estimates of production figures have been made.
Although data processing has been done automatically, the possibility of human error at the data entry stage exists. Since the database is being continuously updated the compilers would be grateful to learn of any corrections and additions that can be made.
Deadline: February 28, 2026
Data received later than February 28, 2026 will be implemented in the next edition of this report.
Please send any remarks to:
Countries - regional and sectoral groups
Global annual mining production is listed in detail by commodity, by continent, country group, development status, per capita income, economic blocs, political stability of producing countries, largest producers and by producing country. Attached you will find information on the producing countries.
An attempt was made to identify the development status of all countries that produce mineral raw materials. The different producer countries were classified according to international standards considering in particular UNCTAD classifications. The classification has been adopted for statistical convenience only.
Important note: The designations "developing" and "developed" are intended for statistical convenience and do not necessarily express a judgement about the stage reached by a particular country or area in the development process. Where the designations "economy" or "country" appear in tables, they cover countries, territories, cities and areas.
Developed, developing countries:
According to OECD GLOSSARY OF STATISTICAL TERMS
There is no established convention for the designation of "developed" and "developing" countries or areas in the United Nations system. In common practice, Japan and Korea South in Asia, Canada and the United States in northern America, Australia and New Zealand in Oceania and Europe are considered "developed" regions or areas. In international trade statistics, the Southern African Customs Union is also treated as developed region and Israel as a developed country; countries emerging from the former Yugoslavia are treated as developed countries; countries of Eastern Europe and former USSR countries in Europe are treated as developed countries; and former USSR countries in Asia are treated as developing countries. For detailed list of developed and developing countries see
https://unstats.un.org/unsd/methods/m49/m49regin.htm
Source: United Nations. Standard country or Area Codes for Statistical Use. Series M, No. 49, Rev. 4 (United Nations publication, Sales No. M.98.XVII.9).
Least Developed Countries:
According to OECD GLOSSARY OF STATISTICAL TERMS
According to the General Assembly, on the recommendation of the Committee for Development Policy, countries listed below are included in the list of the least developed countries (year in brackets indicates the inclusion in the group):
Africa: Angola (1994), Benin (1971), Burkina Faso (1971), Burundi (1971), Central African Republic (1975), Chad (1971), Comoros (1977), Congo, D.R. (1991), Djibouti (1982), Eritrea (1994), Ethiopia (1971), Gambia (1975), Guinea (1971), Guinea-Bissau (1981), Lesotho (1971), Liberia (1990), Madagascar (1991), Malawi (1971), Mali (1971), Mauritania (1986), Mozambique (1988), Niger (1971), Rwanda (1971), Sao Tome and Principe (1982), Senegal (2000), Sierra Leone (1982), Somalia (1971), South Sudan (2012), Sudan (1971), Tanzania (1971), Togo (1982), Uganda (1971), Zambia (1991)
Asia and the Pacific: Afghanistan (1971), Bangladesh (1975), Bhutan (1971-2023), Cambodia (1991), Kiribati (1986), Laos P.D.R. (1971), Myanmar (1987), Nepal (1971), Solomon Islands (1991), East Timor (2003), Tuvalu (1986), Yemen (1971)
Latin America and the Caribbean: Haiti (1971)
Source: United Nations. Office of the High Representative for the Least Developed Countries, Landlocked Developing Countries and Small Island Developing States (OHRLLS). United Nations Internet site https://www.un.org/ohrlls
Economies in Transition:
According to UNCTAD HANDBOOK OF STATISTICS (2021) the category "Economies in Transition" is no longer used. As of 2022 Asean countries of this former category are treated as developing countries and European countries are treated as developed countries.
Asia: Armenia, Azerbaijan, Georgia, Kazakhstan, Kyrgyzstan, Tajikistan, Turkmenistan, Uzbekistan
Europe: Albania, Belarus, Bosnia-Herzegovina, Kosovo, Moldova, Montenegro, Russia, Serbia, North Macedonia, Ukraine
CAS - Central Asia:
Kazakhstan, Kyrgyzstan, Russia-Asia, Tajikistan, Turkmenistan, Uzbekistan
EAS - Eastern Asia:
China, Japan, Korea North, Korea South, Mongolia, Taiwan
EEU - Eastern Europe:
Belarus, Bulgaria, Czechia, Hungary, Moldova, Poland, Romania, Russia-Europe, Slovakia, Ukraine
LAM - Latin America and the Caribbean:
Argentina, Bahamas, Barbados, Bolivia, Brazil, Chile, Colombia, Costa Rica, Cuba, Dominican Republic, Ecuador, El Salvador, French Guiana, Guatemala, Guyana, Honduras, Jamaica, Mexico, Nicaragua, Panama, Paraguay, Peru, Suriname, Trinidad & Tobago, Uruguay, Venezuela
NAF - Northern Africa:
Algeria, Egypt, Libya, Morocco, Sudan, Tunisia
NAM - Northern America:
Canada, Unites States of America
NEU - Northern Europe:
Denmark, Estonia, Finland, Iceland, Ireland, Latvia,Lithuania, Norway, Sweden, United Kingdom
OCE - Oceania:
Australia, Christmas Island, East Timor, Fiji, Nauru, New Caledonia, New Zealand, Papua New Guinea, Solomon Islands
SAS - Southern Asia:
Afghanistan, Bangladesh, Bhutan, India, Iran, Nepal, Pakistan, Sri Lanka
SEAS - South-eastern Asia:
Brunei, Cambodia, Indonesia, Laos, Malaysia, Myanmar, Philippines, Thailand, Viet Nam
SEU - Southern Europe:
Albania, Bosnia and Herzegovina, Croatia, Greece, Italy, Kosovo, Malta, Montenegro, North-Macedonia, Portugal, Serbia, Slovenia, Spain
SSA - Sub-Saharan Africa:
Angola, Benin, Botswana, Burkina Faso, Burundi, Cameroon, Cape Verde, Central African Republic, Chad, Congo D.R., Congo Rep., Cote d'Ivoire, Djibouti, Equatorial Guinea, Eritrea, Eswatini, Ethiopa, Gabon, Ghana, Guinea, Kenya, Lesotho, Liberia, Madagascar, Malawi, Mali, Mauritania, Mauritius, Mozambique, Namibia, Niger, Nigeria, Rwanda, Sao Tomé and Principe, Senegal, Seychelles, Sierra Leone, Somalia, South Africa, South Sudan, Tanzania, Togo, Uganda, Zambia, Zimbabwe
WAS - Western Asia:
Armenia, Azerbaijan, Bahrain, Cyprus, Georgia, Iraq, Israel, Jordan, Kuwait, Lebanon, Oman, Qatar, Saudi Arabia, Syria, Türkiye, United Arab Emirates, Yemen
WEU - Western Europe:
Austria, Belgium, France, Germany, Netherlands, Switzerland
Apart from these, the memberships of various countries in different economic blocks or other cartel-like associations were taken into consideration.
Economic blocks or cartel-like associations were included as follows (in alphabetical order, year of entry in brackets):
ACP Countries: African, Caribbean and Pacific group of states linked to the European Communities as signatory to the Georgetown Agreement and the Lomé Conventions.
Africa: Angola, Benin, Botswana, Burkina Faso, Burundi, Cameroon, Cape Verde, Central African Republic, Chad, Comoros, Congo D.R., Congo Rep., Côte d'Ivoire, Djibuti, Equatorial Guinea, Eritrea, Eswatini, Ethiopia, Gabon, Gambia, Ghana, Guinea, Guinea-Bissau, Kenya, Lesotho, Liberia, Madagascar, Malawi, Mali, Mauretania, Mauritius, Mozambique, Namibia, Niger, Nigeria, Rwanda, Sao Tome and Principe, Senegal, Seychelles, Sierra Leone, Somalia, South Africa, Sudan, Tanzania, Togo, Uganda, Zambia, Zimbabwe
Caribbean: Antigua-Barbuda, Bahamas, Barbados, Belize, Cuba, Dominica, Dominican Republic, Grenada, Guyana, Haiti, Jamaica, St. Kitts-Nevis, St. Lucia, St. Vincent-Grenadines, Suriname, Trinidad and Tobago
Pacific: Cook Islands, Fiji, Kiribati, Marshall Islands, Micronesia, Nauru, Niue, East Timor, Palau, Papua New Guinea, Samoa, Solomon Islands, Tonga, Tuvalu, Vanuatu
ASEAN Countries: Association of South East Asian Nations
Brunei (1984), Cambodia (1999), Indonesia, Laos (1997), Malaysia, Myanmar (1997), Philippines, Singapore, Thailand, Viet Nam (1995)
BRICS Countries:
A 2001 report by Goldman Sachs chief economist Jim O'Neill created the modern term for the four major emerging economies with annual growth rates in economic performance of 5 to 10%. BRICS stands for the initials of the countries of Brazil, Russia, India and China. South Africa joined in 2011. Egypt, Ethiopia, Iran and United Arab Emirates joined in 2024, Indonesia in 2025.
EC (EU): European Community
Austria (1995), Belgium (1952/58), Bulgaria (2007), Croatia (2013), Cyprus (2004), Czech Republic (2004), Denmark (1973), Estonia (2004), Finland (1995), France (1952/58), Germany (1952/58), Greece (1981), Hungary (2004), Ireland (1973), Italy (1952/58), Latvia (2004), Lithuania (2004), Luxemburg (1952/58), Malta (2004), Netherlands (1952/58), Poland (2004), Portugal (1986), Romania (2007), Slovakia (2004), Slovenia (2004), Spain (1986), Sweden (1995), United Kingdom (1973-2020)
EFTA: European Free Trade Association
Austria (until 1994), Denmark (until 1973), Finland (until 1994), Iceland, Liechtenstein, Norway, Portugal (until 1986), Sweden (until 1994), Switzerland, United Kingdom (until 1973)
G7: Group of the Most Important Industrialized Countries
G7 (1976): Canada, Germany, France, Italy, Japan, United Kingdom, United States of America, Russia (1998-2013)
MERCOSUR (Mercado Comun del Sur): Common Market of the South
Treaty since January 1, 1995 between Argentina, Brazil, Paraguay and Uruguay establishing a common market; Bolivia (2024), Venezuela 2006-2017; associated members: Chile, Colombia, Ecuador, Guyana, Panama (2024), Peru, Suriname
OECD: Organization for Economic Cooperation and Development
Australia (1971), Austria (1961), Belgium (1961), Canada (1961), Chile (2010), Colombia (2020), Costa Rica (2021), Czech Republic (1995), Denmark (1961), Estonia (2010), Finland (1969), France (1961), Germany (1961), Greece (1961), Hungary (1996), Iceland (1961), Ireland (1961), Israel (2010), Italy (1961), Japan (1964), Korea, South (1996), Latvia (2016), Lithuania (2018), Luxemburg (1961), Mexico (1994), Netherlands (1961), New Zealand (1973), Norway (1961), Poland (1996), Portugal (1961), Slovakia (2000), Slovenia (2010), Spain (1961), Sweden (1961), Switzerland (1961), Turkey (1961), United Kingdom (1961), United States of America (1961)
SADC: Southern African Development Community
Angola, Botswana, Comoros (2017), Congo D.R. (1997), Eswatini, Lesotho, Madagascar (2005-2009, 2014), Malawi, Mauritius (1995), Mozambique, Namibia (1990), Seychelles (1997-2004, 2008) South Africa (1994), Tanzania, Zambia, Zimbabwe
SCO: Shanghai Cooperation Organisation
China (2001), Kazakhstan (2001), Kyrgyzstan (2001), Russia (2001), Tajikistan (2001), Uzbekistan (2001), India (2017), Pakistan (2017), Iran (2023), Belarus (2024). The SCO is the successor to the Shanghai Five, formed in 1996 between China, Kazakhstan, Kyrgyzstan, Russia and Tajikistan.
USMCA: United States-Mexico-Canada Agreement (former NAFTA)
Canada, Mexico, United States of America. USMCA was established on July 1, 2020 (NAFTA: January 1, 1994 - June 30, 2020).
The worldwide Governance Indicators rely on 31 data sources, including surveys of enterprises and citizens and expert polls, gathered from 25 different organizations around the world (D. KAUFMANN, A. KRAAY & M. MASTRUZZI 2010). These provide data derived from hundreds of questions about governance. Before aggregation is carried out each question is mapped to one of six dimensions of governance: (1) Voice and Accountability; (2) Political Stability and Absence of Violence; (3) Government Effectiveness; (4) Regulatory Quality; (5) Rule of Law; (6) Control of Corruption.
Definition of political stability and absence of violence: A measure of the perception of the likelihood that the government will be destabilized or overthrown by unconstitutional or violent means, including political violence and terrorism.
The values of measurement are indexed with a mean of zero and a standard deviation of one in each period. Virtually all scores lie between -2.5 and +2.5, with higher scores corresponding to better outcomes. The aggregate estimates convey no information about trends in global averages of governance but they are, of course, informative about changes in individual countries over time.
Classes of political stability used in WMD: Estimates < -1.25: extremely unstable; < 0 to -1.25: unstable; > 0 to +1.25: fair; > +1.25: stable.
More information:
Kaufmann, Daniel, Kraay, Aart and Mastruzzi, Massimo, The Worldwide Governance Indicators: Methodology and Analytical Issues (September 2010). World Bank Policy Research Working Paper No. 5430. Available at SSRN:
For analytical purposes, World Bank member economies and all other economies with populations of more than 30 000 inhabitants have been grouped annually according to GNI. Economies are classified annually among income groups to gross national income (GNI) per capita, using the World Bank Atlas method of calculation.
The groups are:
low income (L), lower middle income (LM), upper middle income (UM), high income (H).
Year L LM UM H
2020 <1 045 <4 095 <12 695 >12 695
2021 <1 085 <4 255 <13 205 >13 205
2022 <1 135 <4 465 <13 845 >13 845
2023 <1 145 <4 515 <14 005 >14 005
2024 <1 135 <4 495 <13 935 >13 935
From: World Bank Analytical Classification World Development Indicators GNI per capita in USD: https://datahelpdesk.worldbank.org/knowledgebase/articles/906519-world-bank-country-and-lending-groups
The Herfindahl-Hirschman Index (HHI) is a commonly accepted and used measure of market concentration. HHI is calculated by squaring the market share of each firm competing in the market and then summing the resulting numbers. Only one firm means 100% market share. In this case the HHI would equal 10 000 (100²), indicating a monopoly.
A market consisting of 4 companies with shares of 50%, 30%, 15% and 5%, results in a HHI of (502 +302 +152 +52) = 3 650. The HHI takes into account the relative size and distribution of the firms in a market and approaches zero when a market consists of a large number of firms of relatively equal size. The HHI increases both as the number of firms in the market decreases and as the disparity in size between those firms increases.
In the United States markets, in which the HHI is between 1 000 and 1 800 points, are considered to be moderately concentrated, and those in which the HHI is in excess of 1 800 points are considered to be concentrated. In the EU the threshold for concentrated markets is 2 000.
In WMD the concentration of producer countries is calculated by the HHI similarly to the firms index. To avoid misunderstandings with the "classical" HHI, the countries concentration index is named as (mod)HHI(ct).
Definitions
The information in the World Mining Data largely relate to the calculated metal content in the concentrates produced. More detailed information on the definitions, units, conversion factors, etc. can be found below.
The mineral materials included in World Mining Data are arranged in five groups:
- Iron and Ferro-Alloy Metals
- Non-Ferrous Metals
- Precious Metals
- Industrial Minerals
- Mineral Fuels
Iron and Ferro-Alloy Metals:
Iron, Chromium, Cobalt, Manganese, Molybdenum, Nickel, Niobium, Tantalum, Titanium, Tungsten, Vanadium
Non-Ferrous Metals:
Aluminium, Antimony, Arsenic, Bauxite, Beryllium, Bismuth, Cadmium, Copper, Gallium, Germanium, Indium, Lead, Lithium, Mercury, Rare Earth Minerals, Rhenium, Selenium, Tellurium, Tin, Zinc
Precious Metals:
Gold, Platinum-Group Metals (Palladium, Platinum, Rhodium), Silver
Industrial Minerals:
Asbestos, Baryte, Bentonite, Boron Minerals, Diamond (Gem/Industrial), Diatomite, Feldspar, Fluorspar, Graphite, Gypsum and Anhydrite, Kaolin (China-Clay), Magnesite, Perlite, Phosphate Rock (incl. Guano), Potash, Salt, Sulfur, Talc (incl. Steatite and Pyrophyllite), Vermiculite, Zircon
Mineral Fuels:
Steam Coal (incl. Anthracite and Sub-Bituminous Coal), Coking Coal, Lignite, Natural Gas, Petroleum (incl. Natural Gas Liquids), Oil Sands, Oil Shales, Uranium
Mineral Raw Materials are mineral constituents of the earth's crust which are of economic value. In the most comprehensive sense this includes the so-called "mine output" as well as the output from processing at or near the mines (for instance, the up-grading of ores to concentrates).
Primary Materials are marketable products obtained by processing crude minerals (usually up to the first processing stage only).
Contents of output are mostly calculated empirically.
Weights and Measures:
1 metric ton (metr. t) = 1 000 kg
1 short ton (short t) = 907.2 kg
1 long ton (long t) = 1 016.047 kg
1 pound (lb) = 0.4536 kg
1 troy ounce (oz) = 31.1035 g
1 carat (ct) = 200 mg
Conversion table:
Volume units:
1 cubic foot (ft³) = cubic meter (m³) x 0.028317
1 cubic meter (m³) = cubic foot (ft³) x 35.31467
1 US (=petroleum) barrel (bbl) = 42 liquid US gallons = 158.98 l
1 flask Mercury = 76 lb = 34.5 kg
Conversion for salt brine:
1 m³ x 0.3 = 1 metr. t
Conversion factor for natural gas (approximate method):
1 m³ = 0.8 kg = 0.0008 metr. t
Conversion for crude petroleum (approximate method):
7.33 bbl (barrel) = 1 metr. t
1 bbl = 0.1364 metr. t
1 bbl/d = 49.8 metr. t/a
Conversion factor for lignite (metr. t to TCE = ton coal equivalents):
0.19 Greece, North Macedonia
0.30 Afghanistan, Algeria, Argentina, Bangladesh, Belgium, Belarus, Bhutan, Botswana, Brazil, Burundi, Central African Republic, Chile, Colombia, Costa Rica, Cuba, Czech Republic, Dominican Republic, Ecuador, Egypt, Eswatini, Ethiopia, Falkland/Malvinas Islands, Finland, Georgia, Germany, Haiti, Honduras, Indonesia, Iran, Ireland, Israel, Jamaica, Kazakhstan, Korea North, Korea South, Kyrgyzstan, Malawi, Malaysia, Mali, Mexico, Mongolia, Morocco, Mozambique, Nepal, Netherlands, New Caledonia, Niger, Norway, Oman, Poland, Rwanda, Sierra Leone, Slovakia, South Africa, Spain, Sri Lanka, St. Vincent/Grenadine, Sweden, Taiwan, Tajikistan, Tanzania, Turkmenistan, Remaining Eastern Asia (SWL), Remaining Eastern Europe, former USSR/CIS, Ukraine, United Kingdom, Uruguay, Uzbekistan, Venezuela, Zaire, Zambia, Zimbabwe
0.32 Bosnia-Herzegovina, Croatia, Kosovo, Serbia and Montenegro, Slovenia, former Yugoslavia
0.33 Australia, Cambodia, Denmark, India, Japan, Laos, Madagascar, Myanmar, Nigeria, Pakistan, Peru, Philippines, Romania, Thailand, Turkey, Vietnam
0.36 Italy
0.40 China, France, Hungary
0.45 Russia
0.50 Albania, Austria, Bulgaria, Canada, New Zealand, United States of America
0.58 Portugal
Conversion factor for steam coal, coking coal (metr. t to TCE = ton coal equivalents):
0.60 Czech Republic, Albania
0.65 Indonesia
0.66 Armenia, Georgia, Kazakhstan, Kyrgyzstan, Tajikistan, Ukraine, Uzbekistan
0.70 Cameroon, Chile, Ecuador, Pakistan, St. Vincent/Grenadines, Sweden
0.71 India
0.72 China, Remaining Eastern Asia
0.76 Croatia, Serbia and Montenegro, former Yugoslavia
0.77 Spain
0.78 Japan, Nigeria
0.80 Afghanistan, Algeria, Argentina, Bangladesh, Bhutan, Bolivia, Bosnia-Herzegovina, Botswana, Brazil, Bulgaria, Burundi, Cambodia, Central African Republic, Costa Rica, Cuba, Denmark, Dominican Republic, Egypt, Eswatini, Ethiopia, Falkland/Malvinas Islands, Finland, Greece, Haiti, Honduras, Hungary, Iran, Ireland, Israel, Italy, Jamaica, Korea North, Korea South, Laos, Madagascar, Malawi, Malaysia, Mali, Mexico, Moldova, Mongolia, Morocco, Mozambique, Myanmar, Nepal, New Caledonia, New Zealand, Niger, Norway, Oman, Peru, Philippines, Portugal, Remaining Asia, Romania, Russia, Rwanda, Sierra Leone, Sri Lanka, Taiwan, Tanzania, Thailand, Tunisia, Uruguay, Venezuela, Vietnam, Zaire, Zambia, Zimbabwe
0.82 United Kingdom
0.85 France, Poland, Remaining Africa, South Africa
0.86 Belgium, United States of America
0.90 Australia
0.91 Turkey
0.94 Germany, Colombia
0.95 Canada
Mineral raw materials and ore bodies with significant variations in valuable mineral content have been calculated to obtain the actually useable mineral content, e.g. highly variable Fe-contents of iron carbonates and iron oxides. Production figures throughout this report do not (unless otherwise specified) refer to crude ore (ROM/run of mine) or concentrate produced from it, but indicate the content of recoverable valuable elements and compounds.
Total world production figures do not include Bauxite production as Bauxite is the base raw material in Aluminium production. Production figures for Bauxite can be found in commodity and country statistics.
Iron and Ferro-Alloy Metals:
Iron (Fe) in metr. t
Chromium (Cr2O3) in metr. t
Cobalt (Co) in metr. t
Manganese (Mn) in metr. t
Molybdenum (Mo) in metr. t
Nickel (Ni) in metr. t
Niobium (Nb2O5) in metr. t
Tantalum (Ta2O5) in metr. t
Titanium (TiO2) in metr. t
Tungsten (W) in metr. t
Vanadium (V) in metr. t
Non-Ferrous Metals:
Aluminium (Al, primary) in metr. t
Antimony (Sb) in metr. t
Arsenic (As2O3) in metr. t
Bauxite (crude ore) in metr. t
Beryllium (concentrate) in metr. t
Bismuth (Bi) in metr. t
Cadmium (Cd) in metr. t
Copper (Cu) in metr. t
Gallium (Ga) in metr. t
Germanium (Ge) in metr. t
Indium (In) in metr. t
Lead (Pb) in metr. t
Lithium (Li2O) in metr. t
Mercury (Hg) in metr. t
Rare Earth Minerals (REO) in metr. t
Rhenium (Re) in kg
Selenium (Se) in metr. t
Tellurium (Te) in metr. t
Tin (Sn) in metr. t
Zinc (Zn) in metr. t
Precious Metals:
Gold (Au) in kg
Palladium (Pd) in kg
Platinum (Pt) in kg
Rhodium (Rh) in kg
Silver (Ag) in kg
Industrial Minerals:
Asbestos in metr. t
Baryte in metr. t
Bentonite in metr. t
Boron Minerals in metr. t
Diamonds (Gem) in ct
Diamonds (Industrial) in ct
Diatomite in metr. t
Feldspar in metr. t
Fluorspar in metr. t
Graphite in metr. t
Gypsum and Anhydrite in metr. t
Kaolin (China-Clay) in metr. t
Magnesite in metr. t
Perlite in metr. t
Phosphate Rock (P2O5) in metr. t
Potash (K2O) in metr. t
Salt (Rock Salt, Brines, Marine Salt) in metr. t
Sulfur (elementar and industrial Sulfur) in metr. t
Talc, Steatite and Pyrophyllite in metr. t
Vermiculite in metr. t
Zircon (concentrate) in metr. t
Mineral Fuels:
Steam Coal (incl. Anthracite, bituminous and sub-bituminous Coal) in metr. t
Coking Coal in metr. t
Lignite in metr. t
Natural Gas (marketed production) in Mio m3
Oil Sands (gross production) in metr. t
Oil Shales in metr. t
Petroleum (incl. Natural Gas Liquids) (gross production) in metr. t
Uranium (U3O8) in metr. t
Commodity Prices:
Sources of annual averages:
- Fastmarkets Metal Bulletin
- Fastmarkets Industrial Minerals
- BGR-Rohstoffdatenbank, 2025;
Bundesanstalt für Geowissenschaften und Rohstoffe, Deutschland - U.S. Geological Survey
- Kitco Metals Inc.
- Metal-Pages
- Cameco Corporation
- International Energy Agency (IEA)
- U.S. Energy Information Administration (EIA)
Disclaimer:
World Mining Data is provided as a public service by the Austrian Federal Ministry of Finance (BMF). The information presented does not necessarily reflect the views of the BMF and as such is not an official record.
The BMF makes no guarantee, either express or implied, concerning the accuracy, completeness, or reliability of the information.